Letter to Clients - 4th Quarter 2023
November 2023
Dear Clients and Friends:
I generally write this client letter at the beginning of each calendar quarter, but I didn’t even get this one started until after the kids were trick-or-treating. I apologize for the delay, but I hope the information included will make it worth the wait.
One of the reasons for the delay was I attended a conference in Miami at the beginning of October. The conference was an opportunity to learn more about a software package we are in the process of implementing to better understand, monitor, and match your tolerance for risk and your investment portfolio. By the first quarter of 2024, the software should be fully operational.
The software revolves around the concept of a Risk Number1. Calculated based on Nobel award winning research, the lower the Risk Number the lower the level of risk and volatility and of course the opposite is also true. Even though the Risk Number can range from 0 – 99, the S&P 500 index has a Risk Number of 75.
The first step is to quantify your personal Risk Number and compare it to the Risk Number of your investment portfolio. If your Risk Number is a 65 and your investment portfolio is an 85, we will probably need to make some adjustments.
To determine your Risk Number, you can take a short assessment using this link. The system will notify me that you have taken the assessment, and I can compare it to your investments. Regardless of the outcome I will then let you know what we learned from your assessment. If adjustments are necessary, we can discuss alternative strategies and how your financial goals may be impacted.
After both you and your portfolio are established in the software, we will periodically send you a “check in” email which asks two questions; both of which can be answered with a Thumbs Up or a Thumbs Down. The first question is “How are you feeling about the markets?” and the second question is “How are you feeling about your financial future?" Based on your responses, we will know if we should accelerate our next meeting to not only make sure your financial plan is on track, but that you are comfortable being on that track.
One of our core principles is that we are investors and not traders. Investors do not try to find the inevitable peaks and troughs of market cycles. We maintain discipline and remain invested throughout market cycles because we believe, in the long term, markets reward long term investors. However, we also want to make sure that your comfort level is strong enough to maintain your commitment to the process.
On the front door of the office our slogan, “Get Comfortable!”, is there to remind everyone who enters that DV Financial aims to make you comfortable with your money. This software will help us ensure that you are as comfortable as possible while following your financial plan.
Market Update2
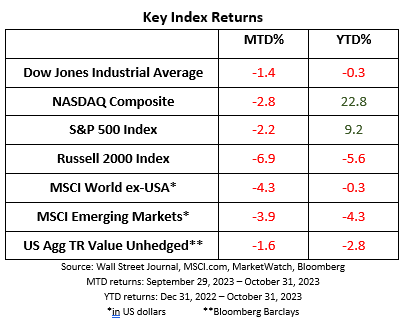
Did you know that the stock market crashes of 1929 and 1987 both happened in the month of October? The devastating financial impact of another crash is probably scarier than any haunted house or horror movie. However, despite these two notable exceptions, the broad market indices such as the S&P 500 have historically performed well in the month of October3 but last month was an exception to that trend.
Economists and analysts agree on the data, but there is no consensus opinion to pinpoint the cause of recent market movements. Gross Domestic Product (GDP) accelerated to a robust annualized pace of 4.9% in the third quarter4 however weakness in smaller company stocks, as illustrated by the selloff in the Russell 2000 index, suggests there are some economic jitters.
Market sentiment was depressed by rising bond yields with the 10-year U.S. Treasury yield briefly exceeding 5% marking the highest yield since 20075. The Fed has indicated that the fed funds rate will remain elevated for an extended period while the federal deficit requires the U.S. Government to continue borrowing by issuing more bonds. It is impossible to precisely measure the effect of federal policy on bond yields, but it is safe to assume that both the Fed’s announced policy and the federal deficit are impacting yields to some extent.

While bonds are generally considered income producing assets, higher yields create competition and reduce the demand for stocks which has an adverse impact on equity positions in investment portfolios.
Not Everything is Under Fed Control
On October 7th, Hamas, a group which has been designated as a terrorist organization by the U.S. as well as the European Union, launched an attack on the nation of Israel and its citizens. Journalists and historians will document the human impact of the situation as information becomes available. However, our role is providing perspective on the insights of investors as well as the impact on the U.S economy.
So far it appears investors believe the violence will be contained. Oil prices, which briefly rose following the attack, ended the monthly slightly below where prices stood on October 6th6. Have investors learned that previous geopolitical events have not had a long-term impact on stock growth?
Not to say that short-term effects are always pain-free. The 1972 Yom Kippur War in Israel led to the OPEC Oil embargo which triggered soaring oil prices and a U.S. recession, but that was an outlier. Today’s oil market is different. The geopolitical dynamics in the Middle East are different. And today the U.S. is one of the world’s leading oil producers. That said, any significant disruption in oil supplies would send the price of crude higher causing other dominos of disruption to topple. However unlikely, such a sequence of events can’t be completely discounted.
What Should You Do?
At DV Financial we are guided by nine core principles which define our approach. The one which applies to times like these is “We are investors, not traders. It is not flashy, but the long-term outlook has withstood the test of time. We seek to capitalize on this trend through patience and discipline.” In other words, we choose ACTIONS over REACTIONS.
Wisdom dictates that we can only control things which are in our control and history teaches us that investor behavior plays an important role in long-term investment returns. Have you considered how you typically react when markets soar or faulter? Does euphoria lead you to become too aggressive? Does market weakness urge you to sell after prices have tumbled?
We opened this client letter by introducing our new risk management software. If sitting idle does not feel appropriate to you, I encourage you to act by taking the risk assessment. Then we can respond appropriately together and determine if adjusting your financial plan or your investments are reasonable actions.
Your financial plan should not be set in stone, but it should be the blueprint to help achieve your financial goals. When your risk tolerance, goals, and investment portfolio are current and coordinated, the discipline to remain invested throughout market cycles becomes easier. This, in turn, will allow you to capitalize on the rewards the markets provide for long-term investors.
We continue to be humbled and honored to work with you as your financial advisor. If you have any questions or concerns, we can make an appointment to address your issues. If you know of anyone who would benefit from the services we provide, please let them know about your experience with us.
Sincerely,
Art Dinkin, CFP®
This newsletter contains general information that may not be suitable for everyone. The information contained herein should not be construed as personalized investment advice. Past performance is no guarantee of future results. There is no guarantee that the views and opinions expressed in this newsletter will come to pass. Investing in the stock market involves gains and losses and may not be suitable for all investors. Information presented herein is subject to change without notice and should not be considered as a solicitation to buy or sell any security.
Not associated with or endorsed by the Social Security Administration or any other government agency.
Indices are unmanaged and investors cannot invest directly in an index. Unless otherwise noted, performance of indices does not account for any fees, commissions or other expenses that would be incurred. Returns do not include reinvested dividends.
The Dow Jones Industrial Average (DJIA) is a price-weighted average of 30 actively traded “blue chip” stocks, primarily industrials, but includes financials and other service-oriented companies. The components, which change from time to time, represent between 15% and 20% of the market value of NYSE stocks.
The Nasdaq Composite Index is a market-capitalization weighted index of more than 3,000 common equities listed on the Nasdaq stock exchange. The types of securities in the index include American depositary receipts, common stocks, real estate investment trusts (REITs) and tracking stocks. The index includes all Nasdaq listed stocks that are not derivatives, preferred shares, funds, exchange-traded funds (ETFs) or debentures.
The Standard & Poor's 500 (S&P 500) is an unmanaged group of securities considered to be representative of the stock market in general. It is a market value weighted index with each stock's weight in the index proportionate to its market value.
The Russell 2000 Index is an unmanaged index that measures the performance of the small-cap segment of the U.S. equity universe.
The MSCI All Country World Index ex USA Investable Market Index (IMI) captures large, mid and small cap representation across 22 of 23 Developed Markets (DM) countries (excluding the United States) and 23 Emerging Markets (EM) countries*. With 6,062 constituents, the index covers approximately 99% of the global equity opportunity set outside the US.
The MSCI Emerging Markets Index is a float-adjusted market capitalization index that consists of indices in 21 emerging economies: Brazil, Chile, China, Colombia, Czech Republic, Egypt, Hungary, India, Indonesia, Korea, Malaysia, Mexico, Morocco, Peru, Philippines, Poland, Russia, South Africa, Taiwan, Thailand, and Turkey.
Barclays Aggregate Bond Index includes U.S. government, corporate, and mortgage-backed securities with maturities of at least one year.
1 The Six Month 95% Probability Range is calculated from the standard deviation of the portfolio (via covariance matrix), and represents a hypothetical statistical probability, but there is no guarantee any investments would perform within the range. There is a 5% probability of greater losses. The underlying data is updated regularly, and the results may vary with each use and over time.
IMPORTANT: The projections or other information generated by Riskalyze regarding the likelihood of various investment outcomes are hypothetical in nature, do not reflect actual investment results and are not guarantees of future results. These figures may exclude commissions, sales charges or fees which, if included would have had a negative effect on the annual returns. Investing is subject to risk and loss of principal. There is no assurance or certainty that any investment strategy will be successful in meeting its objectives.
2 This material represents an assessment of the market and economic environment at a specific point in time and is not intended to be a forecast of future events, or a guarantee of future results. Forward-looking statements are subject to certain risks and uncertainties. Actual results, performance, or achievements may differ materially from those expressed or implied. Information is based on data gathered from what we believe are reliable sources. It is not guaranteed as to accuracy, does not purport to be complete and is not intended to be used as a primary basis for investment decisions. It should also not be construed as advice meeting the particular investment needs of any investor. Past performance does not guarantee future results.
3 St. Louis Federal Reserve
4 U.S. Bureau of Economic Analysis
5 CNBC
6 MarketWatch


