


Letter to Clients - 3rd Quarter 2022
July 2022
Dear Clients and Friends:
As a kid, glorious summer vacations seemed to last forever. Now, as I sit down to write this letter, there is still a ringing in my ears from the fireworks celebrations of Independence Day and it hardly feels like we are closer to next Christmas than last New Year’s Day. How can we be at the halfway point of the year already? We hope that you are taking some time to stop and enjoy summer before this one is behind us. Are you taking a special vacation, tackling projects at home, or spending time with family? Let us know. As your financial advisor, we want to know you as a whole person. The financial planning process should not be limited to just your financials.
You may hear a different voice answering the phone as Linda Moore is no longer on our team. We enjoyed working with Linda over the past year and wish her success and happiness. Hopefully we will be introducing our next administrative person soon.
We are very excited about some new software we recently introduced which addresses a very common question. Many of our clients are employed and have significant assets in their employer’s 401k plan and ask us for help with their retirement funds. Before this software, we did our best to help you review the investment options and put together a recommended portfolio. While this was better than doing nothing, looking at an account once is not nearly as effective as ongoing monitoring and rebalancing[1].
Thanks to our new software, we can now manage and maintain most active 401k accounts! If you have online access to your employer’s retirement plan, there is a high probability that we can connect it to our system and manage it on your behalf. Studies indicate that professionally managed accounts generate 3-4% higher returns per year, net of fees, than self-managed accounts and that this effect can yield up to 75% more wealth over 20 years[2].
If you have an active 401k plan and would like to reap the rewards of professional management of your retirement funds, please let us know.
A Rocky First Half
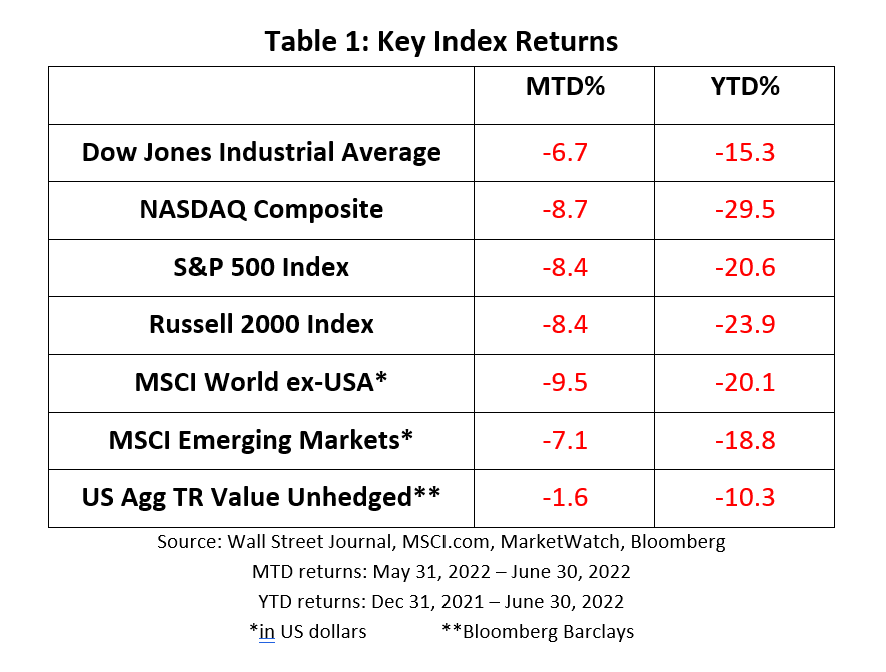
The Wall Street Journal summed up the first six months of the year with a simple but telling headline on June 30th: S&P 500 Posts Worst First Half of Year since 1970[3]. Investment research firm Morningstar said the Dow’s performance was the worst since 1962[4].
Perspective is important. Both the S&P 500 and the Dow Jones Industrial Index both set all-time highs during the first week of 2022[5]. When the market peak just about perfectly aligns with the New Year, Year-to-Date performance reflects the full effect of the market downturn. Most pundits classify the market as a “bear” when a broad-based index has fallen 20% or more from a prior peak. The S&P 500 Index shed 23.6% from its January 3rd peak to its June 16th trough which signals we can now consider this a bear market.
Downturns are a natural market cycle. Since 1957 there have been 13 bear market periods where the S&P 500 has declined 20% or more over six months[6] which means bear markets occur about every five years. Six of the seven worst selloffs centered around the 2008 financial crisis with losses ranging from 29.4% to 42.7%. The one outlier occurred in 1974 when the S&P 500 shed 32% over a six-month period.
Today’s market weakness shares little in common with 2007-2008, when a housing bubble fueled by weak lending standards and massive speculation nearly brought down the financial system. Housing prices have risen and some may think we are in a bit of a real estate bubble, but bank capital standards are much stronger and lending practices are significantly tighter since the last bubble burst. Moreover, the pin which burst the bubble and triggered the financial crisis was an oversupply of homes. Today it is just the opposite, the housing market runup has been fueled by limited supply.
The Great Recession of 2008 is not a good comparison for the economic conditions of today. A much better comparison would be lessons learned from the early 1970’s.
That 70’s Show
In 1972 the Consumer Price Index (CPI) soared from an annual rate of 2.7% to over 12% by the end of 1974[7]. In response, the prime loan rate leapt from 4.75% in early 1972 to a peak of 12.0% in July 1974[8]. The prime rate has not been a popular discussion topic lately. Today the financial news gives more attention to the federal funds rate although the two strongly correlated.
Inflation from the 1970’s and today share several similarities including loose fiscal policy and soaring oil prices but there are some differences. Today, the U.S. is not as dependent on foreign oil which, paired with advancements in fuel efficiency, mitigates some of the impact of oil prices. However, rising gasoline prices are playing a significant role in the changing CPI which increased 8.6% in May[9]. Some people are drawing conclusions from soaring energy prices coupled with sharp rises in interest rates which contributed heavily to a recession that began in late 1973 and persisted until early 1975[10] and worry that we are headed for a similar recession now. Some commentators believe we are already in a recession. While there are definite parallels between the 1970’s and today, no two period are exactly alike.
Most bear markets lead to recession. With the exception of the one-day market crash of 1987, the last time a bear market did not signal a recession was in 1966 when the S&P 500 dropped 22% but a recession was avoided. Fed Chief Jerome Powell continues to talk about the importance of controlling inflation. The Fed seems to be more concerned about inflation than it is with avoiding a recession. No one would argue that economic growth has slowed, and consumer confidence hit a 50 year low in June 2022[11]. However, a recession is not a forgone conclusion.
Although a decline in Q2 GDP is a very distinct possibility, job growth has been robust, layoffs remain low, and consumers are spending on travel and other services unavailable during the recession (just ask anyone who has had to deal with cancelled flights this summer). Furthermore, Moody’s Analytics argues that plenty of stimulus cash remains in consumers bank accounts and typical recessionary indicators, such as rising loan deficiencies, have yet to materialize[12].
Over the next several months we expect there to be considerable debate over the definition of “recession”. The commonly accepted definition of a recession is two consecutive quarters (or more) of reduced GDP. We believe that while we very well may have a “technical recession” because the common definition may be fulfilled, there is a big difference between an economy which is failing to grow and one which is contracting. To us, and most investors, it does not matter what word(s) economists use to define the situation. Instead, we focus on our fundamental investment philosophies which have never failed us in the long term.
Things We Know For Certain
- Today’s economic fundamentals have created stiff headwinds for all asset classes.
- No one can identify the “bottom” of a market cycle in advance. They can only pinpoint when it happened long after it has passed.
- While pullbacks and bear markets are inevitable, we know they can create unwanted angst.
- There will be, at some unknown time, an unexpected favorable shift in economic fundamentals which will fuel a recovery rally.
- With over 200 years of stock market history to draw from, the current bear market is the only one from which the market has not (yet) recovered.
- We recovered from the bear market of 1974.
- We recovered from the bear market triggered by the 2008 financial crisis.
- We recovered from the swift bear market and short recession which followed COVID lockdowns.
- We know that times like these can be difficult. If you have questions or would like to talk, we are only an email or phone call away.
One can never predict the future with perfect accuracy, but we remain confident that this bear market will end and the next bull market will begin. Do you recall that we mentioned consumer confidence has reached a new 50 year low? There have been 8 consumer sentiment troughs in the last 50 years. In the 12 months following each trough the average subsequent return in the S&P 500 is 24.9%. We sincerely hope that the new consumer confidence low established in June is, in fact, the bottom of the trough and the next year will once again be profitable.
It won’t be long until the humidity subsides, and the days grow shorter. Before we know it, the Iowa State Fair will be over, kids will be back in school, warm summer breezes will turn to cool autumn winds, and the leaves will begin to fall.
We are honored and humbled to serve as your financial advisors. Let us know if you have any questions, concerns, want to touch base and update your plans, or if you’d like to explore our new 401k management software. We welcome to the opportunity to serve you.
Sincerely on behalf of the DV Financial team,
Art Dinkin, CFP® & Patrick Owens
[1] Rebalancing/Reallocating can entail transaction costs and tax consequences that should be considered when determining a rebalancing/reallocation strategy.
[2]Vanguard and Russell Investments
[4] Morningstar
[5] St, Louis Federal Reserve
[6] CNBC
[7] St. Louis Federal Reserve
[8] St. Louis Federal Reserve
[9] U.S. Bureau of Labor Statics
[10] National Bureau of Economic Research
[11] FactSet
[12] St. Louis Federal Reserve.
This newsletter contains general information that may not be suitable for everyone. The information contained herein should not be construed as personalized investment advice. Past performance is no guarantee of future results. There is no guarantee that the views and opinions expressed in this newsletter will come to pass. Investing in the stock market involves gains and losses and may not be suitable for all investors. Information presented herein is subject to change without notice and should not be considered as a solicitation to buy or sell any security.
The Consumer Price Index (CPI) is a measure of inflation compiled by the US Bureau of Labor Studies.
Indices are unmanaged and investors cannot invest directly in an index. Unless otherwise noted, performance of indices does not account for any fees, commissions or other expenses that would be incurred. Returns do not include reinvested dividends.
The Dow Jones Industrial Average (DJIA) is a price-weighted average of 30 actively traded “blue chip” stocks, primarily industrials, but includes financials and other service-oriented companies. The components, which change from time to time, represent between 15% and 20% of the market value of NYSE stocks.
The Nasdaq Composite Index is a market-capitalization weighted index of the more than 3,000 common equities listed on the Nasdaq stock exchange. The types of securities in the index include American depositary receipts, common stocks, real estate investment trusts (REITs) and tracking stocks. The index includes all Nasdaq listed stocks that are not derivatives, preferred shares, funds, exchange-traded funds (ETFs) or debentures
The Standard & Poor's 500 (S&P 500) is an unmanaged group of securities considered to be representative of the stock market in general. It is a market value weighted index with each stock's weight in the index proportionate to its market value.
The Russell 2000 Index is an unmanaged index that measures the performance of the small-cap segment of the U.S. equity universe.
The MSCI All Country World Index ex USA Investable Market Index (IMI) captures large, mid and small cap representation across 22 of 23 Developed Markets (DM) countries (excluding the United States) and 23 Emerging Markets (EM) countries*. With 6,062 constituents, the index covers approximately 99% of the global equity opportunity set outside the US.
The MSCI Emerging Markets Index is a float-adjusted market capitalization index that consists of indices in 21 emerging economies: Brazil, Chile, China, Colombia, Czech Republic, Egypt, Hungary, India, Indonesia, Korea, Malaysia, Mexico, Morocco, Peru, Philippines, Poland, Russia, South Africa, Taiwan, Thailand, and Turkey.
Barclays Aggregate Bond Index includes U.S. government, corporate, and mortgage-backed securities with maturities of at least one year.